
Under the Hood of the Ethica Data Processing Pipeline
Introduction
Health research and clinical trials often are dealing with massive amounts of data. This data comes from a variety of sources, such as surveys, medical records, sensors, and digital biomarkers. The ever-increasing volume and variety of data require utilizing data-driven technologies to manage the flow of data. A data pipeline is an efficient way to achieve this. It can gather raw data from various sources, perform necessary operations on it, and transfer it to another location for either storage or analysis.
At Ethica we handle large amounts of data coming from a large number of health and clinical studies. The component that is responsible for handling the flow of the data is called Ethica Data Pipeline. We recently redesigned our data pipeline from ground up, to better monitor this data flow and to improve our data quality. The new data pipeline is built using state of the art data processing technology, and also includes certain features that will be explained below. Please note that the content may be very technical. Don’t worry about it. We will write another article soon, explaining how these can be used in your day-to-day research work.
In what follows, we will:
- Provide you with the definition of several useful technical terms,
- Explain how data pipelines work in general and explain why they are important,
- And then discuss the old and new data pipelines at Ethica.
Technical Terms
Below you can find definitions of some technical terms that can help you better understand this article. We will also provide examples from our data pipeline for more clarity. Note that you may choose to skip this section and only come back to it if a certain term in the article does not make sense.
- Data Flow is the movement of information from one part of the system to another. Our "sensor data flow" is a good example. Ethica's smartphone app collects sensor data and uploads it to our server as data files. Then, the server receives the uploaded files, extracts containing sensor data, and puts them in the right place (databases). The entire process is called Data Flow.
- Volume refers to the size of the data which should be analyzed and processed.
- Variety refers to different formats of the data. A data pipeline often must recognize and process data in many formats, as they come in from different sources.
- Data Aggregation is the process of compiling large amounts of data from a database and organizing it in a more comprehensible way. For example, if we want to know how many records we have from each type of data, instead of counting them every time, we can store the count in a table called
record_count. This way, we can sayrecord_countcontains aggregated data. - Data Transformation (or Data Parsing) is the process of converting data from the format of a source system to the format of a destination system. An example of this is the transformation we apply on data from Garmin wearables. Daily summaries reported from Garmin wearables include information about each user's heart rate throughout the day. We extract this data from daily summaries and transform it to a format that is easier to analyze. The following is an example of heart rate data we receive from Garmin wearables:
{
    "startTimeInSeconds": 1452470400,
    "timeOffsetHeartRateSamples": {
        "15": 75,
        "30": 75,
        "3180": 76,
        "3195": 65
    }
}
We transform this into the following list of heart rate records:
[
    {
        "record_time": 1452470400015, # 1452470400 + 15
        "bpm": 75
    },
    {
        "record_time": 1452470400030, # 1452470400 + 30
        "bpm": 75
    },
    {
        "record_time": 1452470403180, # 1452470400 + 3180
        "bpm": 76
    },
    {
        "record_time": 1452470403195, # 1452470400 + 3195
        "bpm": 65
    }
]
- Data Validation refers to the practice of checking the quality and accuracy of data before being processed. For example, we check to make sure that the lat (latitude) column of GPS records is between -90 to 90, or the steps column of each pedometer record is not empty.
What is a Data Pipeline, and Why Is It Important?
A Data Pipeline is a software program that contains three key elements:
- A source is where the data comes from (such as a participant’s wearable device).
- Processing steps are a number of operations that are applied to the data extracted from a source. These processing steps may include transformation, filtering, and aggregation of data.
- Destination is the location where the data arrives at the end of processing (such as a database where the processed data are stored).
The data as they enter the pipeline are not always very clean and smooth. They may contain many issues. For example, the data may be corrupted, or they may contain duplicate values. That is why data pipelines play a critical role in handling data. Any software such as Ethica that relies on automated gathering, transformation, and distribution of data, needs to have an effective data pipeline.
When it comes to the medical data flow, data pipelines become even more important. In health research, every single record of data must be properly documented based on the ALCOA concept. So even the slightest error can jeopardize the validity of the entire study. This considerably increases the role of a proper data pipeline in a clinical data collection platform.
Data Pipeline at Ethica
Ethica handles a large number of records for many research projects. These data can be divided into two categories:
- Data records that are proactively entered into the Ethica app by participants, such as survey responses, or responses to the cognitive tasks. Most researchers know how to analyze these data using common tools such as R or SPSS. It’s also easy to monitor participants’ adherence for these data sources.
- Data records that are passively collected from participants’ sensor devices, either from their smartphone, or their wearable device, such as their step count, or heart rate measurements. It’s a lot more challenging to analyze these data, or monitor participant adherence.
Initial version of Ethica used a data pipeline only for passively collected sensor data, in which the data uploaded from sensors were only stored as bulk into our databases. No processing, validation, or transformation was applied on the data. This year, we redesigned our data pipeline from the ground up, using state-of-the-art data analysis tools. The new design allows us to monitor and validate our data flow, ensure a minimum expected quality, and even transform the data into formats that are easier to understand and analyze by researchers.
Previous Data Pipeline
In the older version of the data pipeline, the sensor data was uploaded onto the server as files. These files were stored into a folder awaiting to be processed.
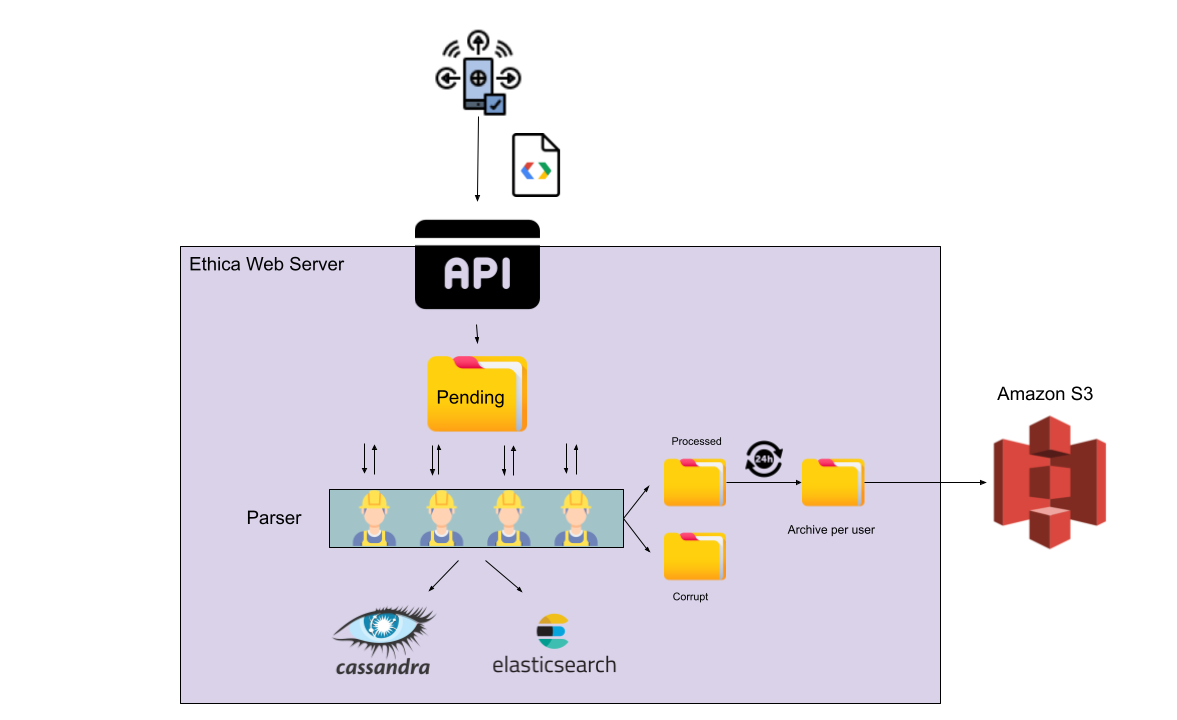

A number of workers called Parser Workers continuously monitored this directory, and as soon as a new file would arrive, they transferred its content to the database. Two copies of the data were stored in two databases, Elasticsearch and Cassandra, without any form of transformation or validation.
Note that both Elasticsearch and Cassandra are databases used for managing vast volumes of data. Cassandra is a very fast database which stores a large amount of data in a very small space. This makes it ideal for archiving large amounts of data. However, it’s very challenging to search for particular data in Cassandra. That’s where Elasticsearch comes into play. Elasticsearch is slower than Cassandra, and takes a lot more space, but has very strong search capabilities. By storing the data in both these databases, we could have gained both benefits, and have multiple backups from our data as well.
New Data Pipeline
Before describing the different stages involved in the new data pipeline, we need to explain why we redesigned our data pipeline. We launched our new data pipeline for these reasons:
- To validate sensor data as they are received from participants’ devices. Using these validations, we can detect possible issues in our system that can lead to data corruption.
- To clean sensor data. Cleaning steps are different for different types of data. But generally they try to fix expected issues that are detected in the validation step. For example, if a record or a given value in a record is corrupted, this record is marked and removed. Or if a duplicate record is identified, it’s removed from the data.
- To perform post-processing on the data, and add new features to them. For example for GPS data, we pass data through our Machine Learning models to infer the mobility mode of each record, i.e. whether they were stationary, walking, biking, or driving.
- To monitor the quality of the data with our alerting system, so if an important issue happens, we can immediately detect and fix it, and recover potentially failed data batches. This will avoid missing data or inserting corrupt data into our databases.
We also decided not to insert the raw sensor data (This is the sensor data before going through the data pipeline) into the Elasticsearch database, and only store them in Cassandra. This way, we reserved Elasticsearch only for processed data. The raw sensor data in Elasticsearch was taking up too much space, and often no one needed to search in them. By removing the raw data from Elasticsearch and only keeping processed data there, we managed to substantially reduce the amount of storage we used, while at the same time allow researchers to search within their data.
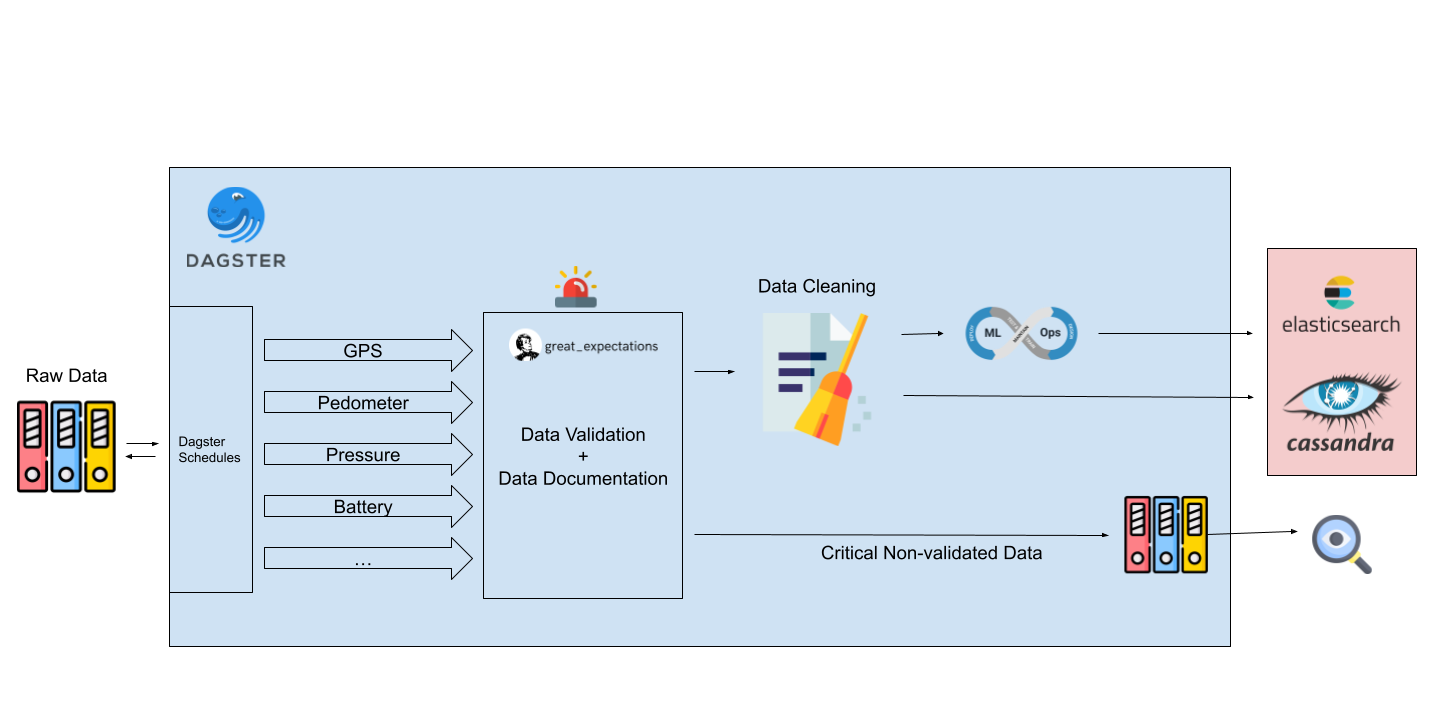

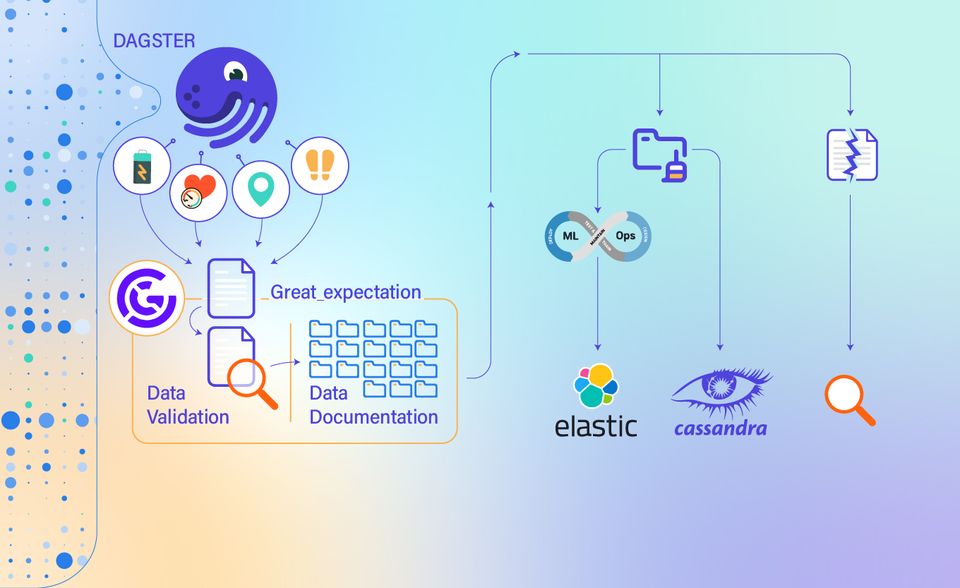
The new data pipeline performs four distinct tasks on the incoming data: validation, documentation, cleaning, and post processing. We utilize a tool called Dagster to establish our data pipeline, which includes the following stages:
- Initially, Dagster checks all the data collected within the past hour, and for every data source for which we have received data, it starts the relevant data processing job.
-
In the next stage, Data Validation and Data Documentation take place via another tool called Great Expectations. In our new data pipeline, we have defined a set of validations for each data source, which determine what characteristics that data source must or must not have. These validations can be one of the following categories:
- Critical validation which deals with serious issues that must be addressed immediately.
- Warning validation that is concerned with less important issues. These issues are mainly caused by the sensors collecting the data. Sometimes sensors collecting the data fail to collect the accurate data, or malfunction. This causes the collected data to have wrong features. For example a broken sensor or GPS functioning in an indoor environment.
- Later, the collected data will be moved to the Data Cleaning stage. At this stage, we either fix the issues detected in the data or remove the invalid data that is not fixable and have no meaningful value. We also remove the duplicate records in each batch of data. All removed data are stored in a separate location for further manual examination.
- After data cleaning, Post Processing takes place. This basically means we run the data through our AI and Machine Learning models, to add new features to the data. We currently have AI/ML models for GPS and App Usage data sources. For GPS, the model is trained to detect the mobility mode, such as walking, biking, or driving. For App Usage data, the model is trained to transform the data into a format that is easier to analyze by the researchers.
- The data will be eventually inserted into our databases. The raw data, i.e. the data as they were received, is stored in Cassandra, and the processed data, i.e. the data which is the output of our data pipeline, is stored in Elasticsearch.
Wrap up
We recently launched a new data pipeline based on state-of-the-art data processing technologies. The new data pipeline consists of four stages: data validation, data documentation, data cleaning, and post processing. The result of these four stages is that it allows us to monitor and validate the data flow across our platform, ensure a minimum expected quality, and further transform the data into formats that are easier to understand and analyze by researchers.