Data Access & Analytics
Access and Analyze Data in Real-Time
Your study data are processed and made available, minutes after it’s uploaded from your participants. You can easily access them either by downloading the data to your own environment, or by using analysis tools available in Avicenna’s researcher dashboard.
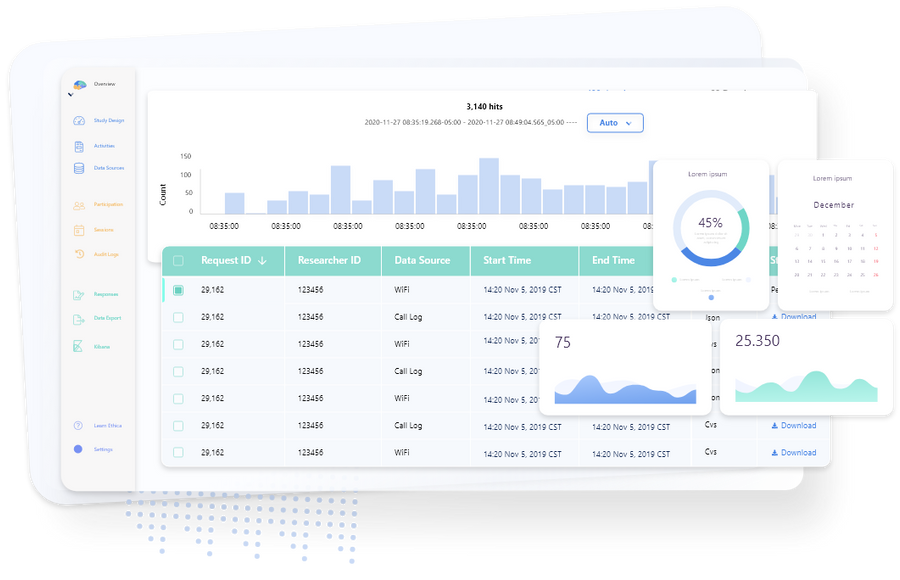
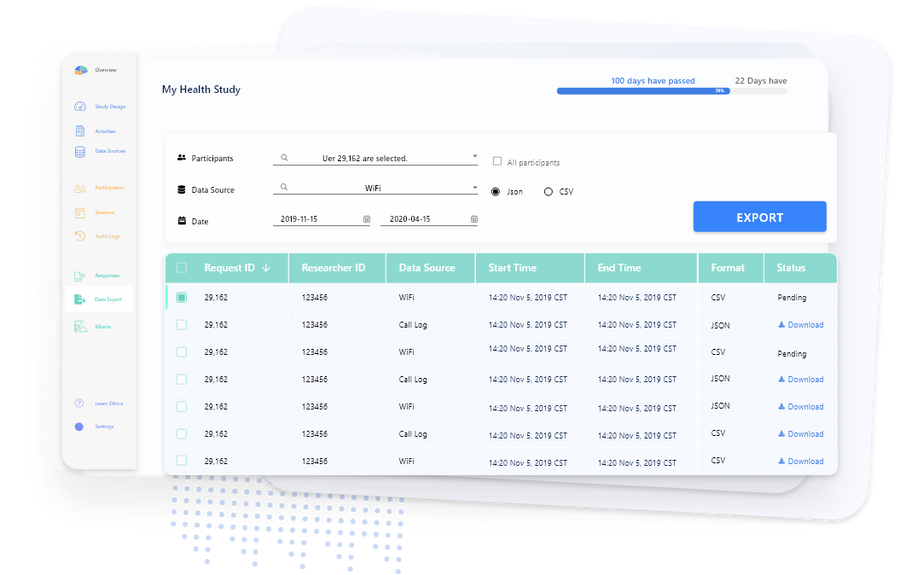
Export Data
You can simply export any data related to your study, and analyze them in the tool of your choice. Avicenna supports CSV and JSON, or other formats depending on the type of data, such as GEXF for network graphs, or KML for location data.
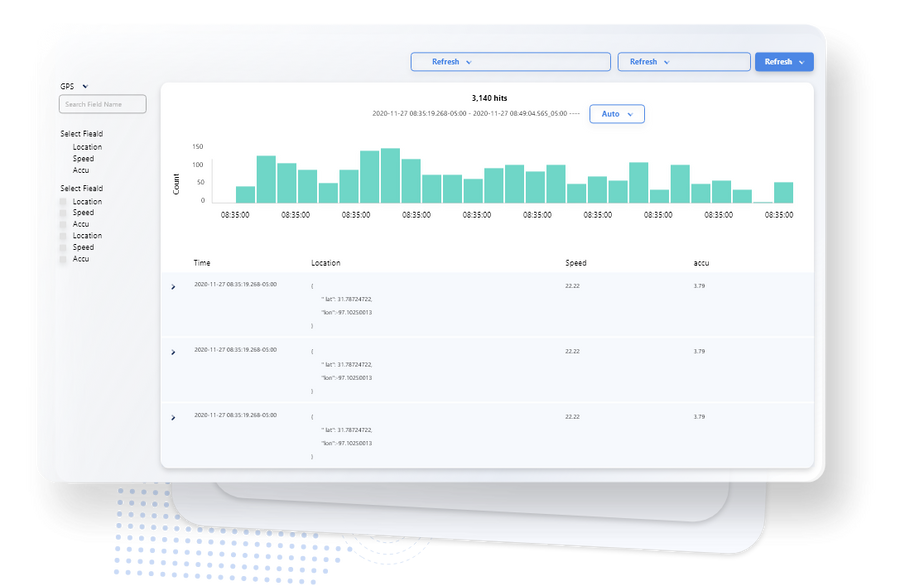
Discover Your Data Directly from Your Dashboard
Avicenna allows you to access your study’s underlying data storage directly from your researcher dashboard, read the data as they are received, and query the data. This can help with spot checking the data and getting more familiar with the nature of your data.
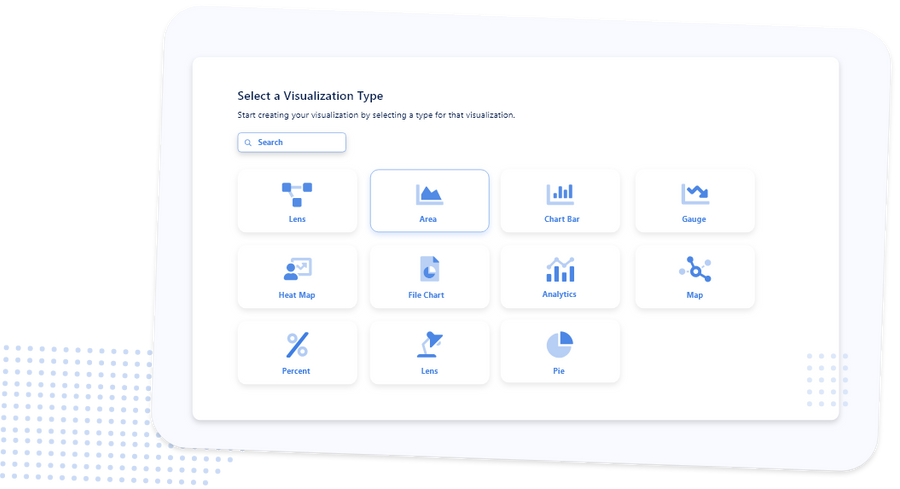
Create Hundreds of Charts
Avicenna’s integration with Kibana and VEGA visualization grammar allows you to choose from hundreds of available graphs, or create your own, directly from your browser. The graphs are saved as part of your dashboard and are updated in real-time with most recent data from your participants.
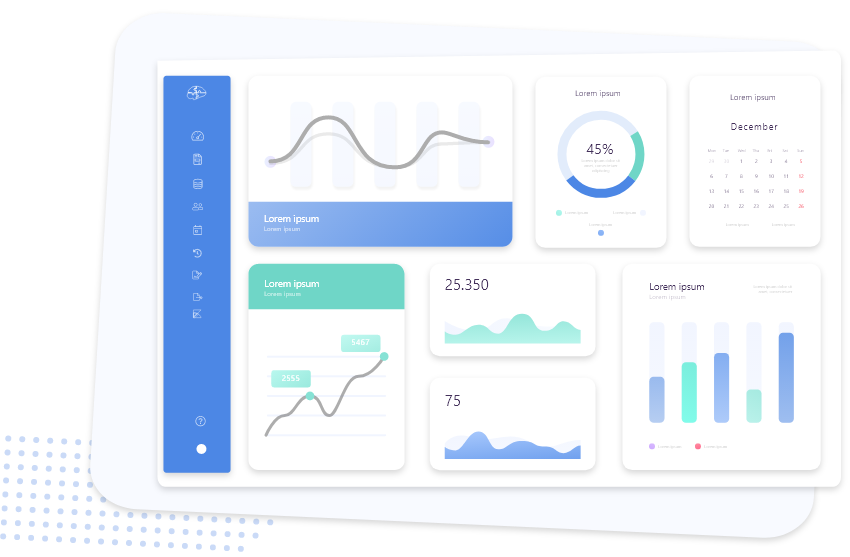
Present Insights via Dashboards and Infographics
Avicenna allows you to combine your charts into dashboards and infographics. This way you can easily set up a live dashboard for monitoring important metrics of your field deployment, or can present an interactive webpage to your team to gain insights on the collected data.

© 2023 Avicenna Research
4109 - 295 Adelaide St W Toronto, ON, M5V 0L4 Canada
